 Discover the mean features of Reports for Geoconcept 1.0
Models
Using a wizard, the user defines a report template made up of elements known as “blocks” (maps, graphs, texts, tables, dynamic formulae and pagination elements).
These blocks are contained in “bands” which give the report its structure. The model is then saved in a specific folder in XML format for application to one or a number of reference entities.
Formats
A number of output formats are offered: PDF, XLS, XLSX, HTML, RTF, TXT, CSV as well as the PNG, JPEG, GIF, TIF, etc image formats.
One and the same report can be published in different formats.

Data
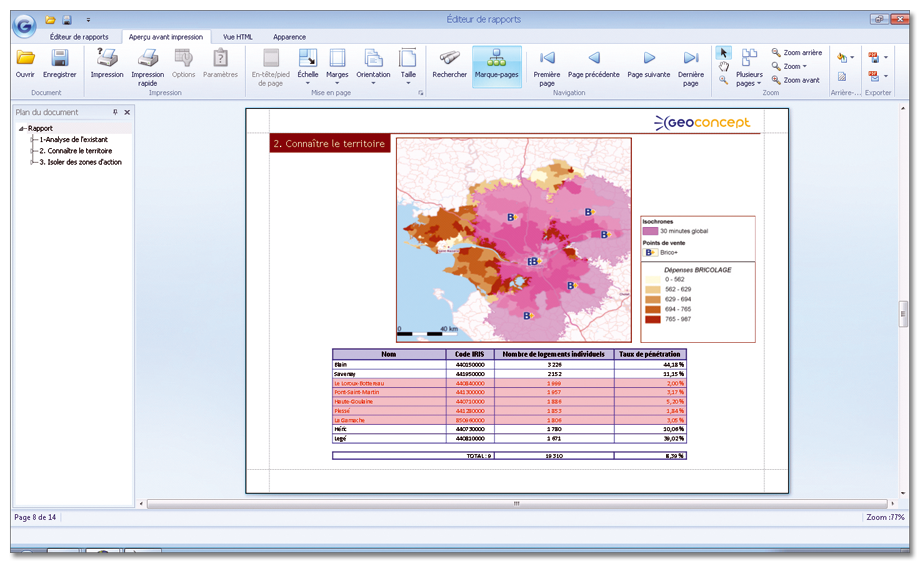
The information manipulated in Reports for Geoconcept is directly and dynamically linked with the geographical data in the GIS. The model then interrogates objects on the map (geographical selection, query, list) and the report is generated on the selected reference entities (territories, regions or departments, shops or any other point object).
Dynamic text
Styles
The user can define then reuse graphical styles to customise the appearance of the blocks. This automates and standardises the report formatting. A style may, for example, ensure that a company’s graphic design standards are applied by the different services within the company.
Expert
Advanced functions are available for the more experienced :
sub-reports, integration of barcodes, pivot tables, coverage analysis…
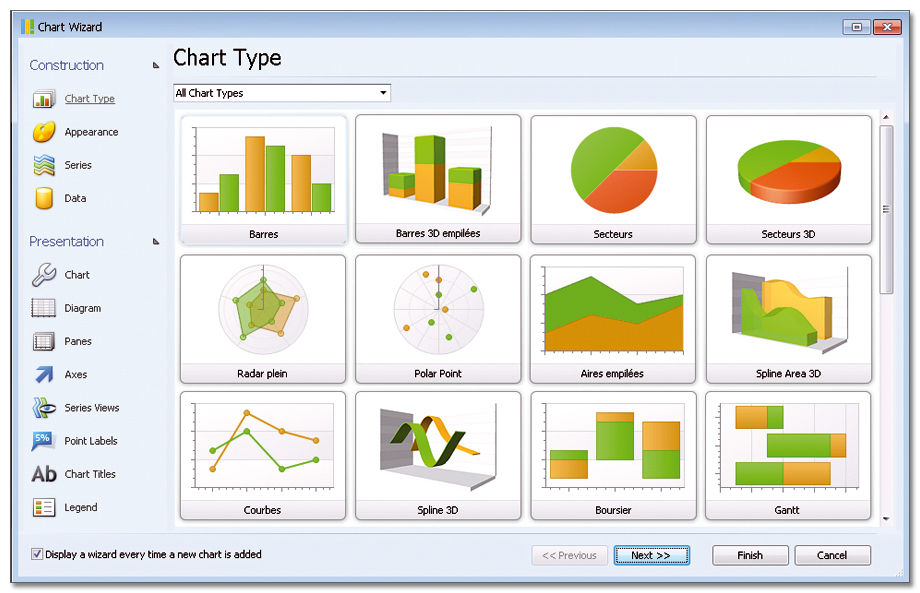
Graphs
Reports for Geoconcept enables map data to be presented in graph form. 47 types of display are available: pie charts, histograms, radar, curves, Gantt charts…
Tables
Reports for Geoconcept enables geographical data to be displayed in tabular format and calculation formulae applied to them. Sum, average, sort…numerous operators are available, from the simplest to the most complex. The results obtained can be highlighted using conditional formatting.