The catchment area is the geographic area from which an agency or a sales outlets attracts its main customers, whether prospective or existing.
Catchment area analysis is an indispensable decision support tool for evaluation and optimizing the distribution of your network of sales outlets or services.
What different types of catchment area are there, and what are they used for?
The convex area
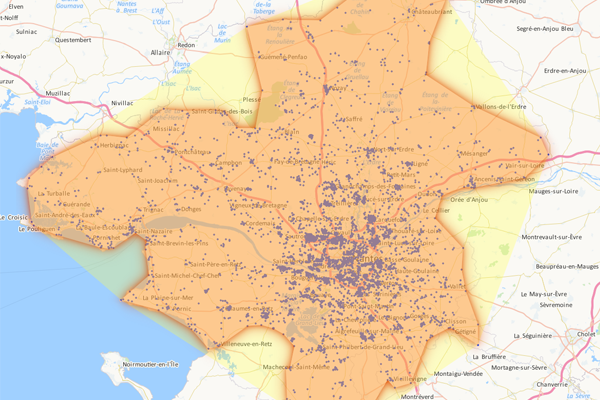
The convex area is defined “as the crow flies” around a sales outlet and comprises all the customers assigned to it. It represents the store’s or agency’s minimum area of attraction and makes possible rapid identification of whether two or more sales outlets are covering the same area. In this specific instance one talks about cannibalization. The convex area is represented by a wide circular area around the sales outlet (yellow area). The representation of this area can be fine tuned by restricting the geographical envelope to the points contained within the area (orange area): you then generate a concave area.
The isochrone area and the isodistance area
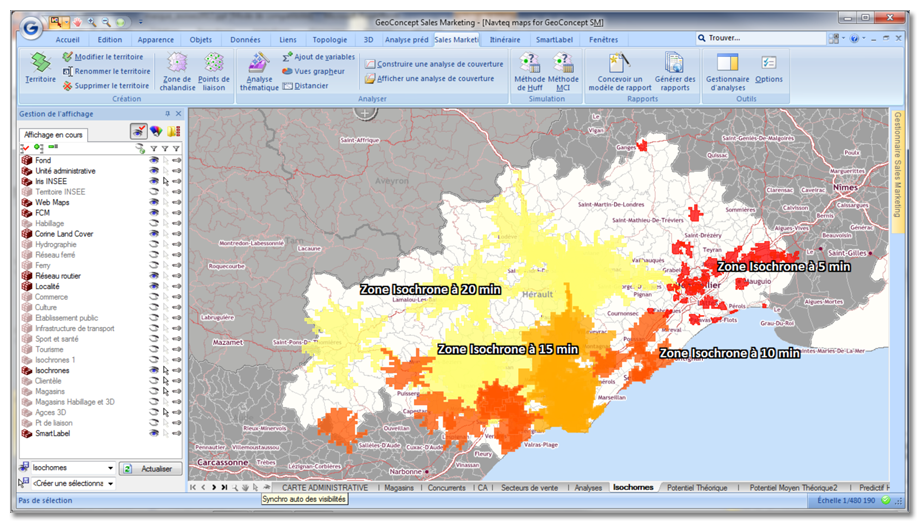
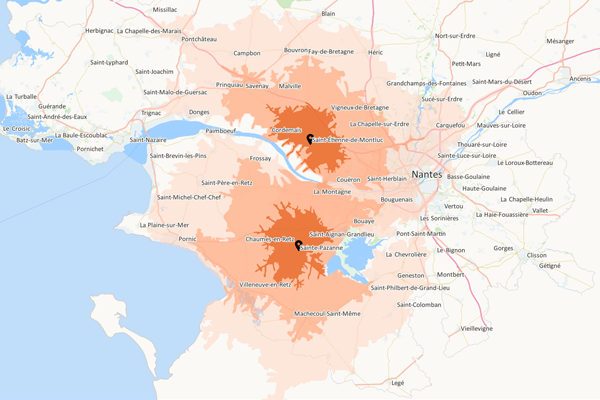
The isochrone area and the isodistance area respectively represent the areas accessible within a defined time or distance around a sales outlet, an agency, a site, and enable its potential customer base to be measured. The calculation of these areas takes account of traffic speeds and accessibility characteristics to define the most accurate possible representation. Typically, three areas are studied simultaneously: the primary, secondary and tertiary areas corresponding to areas accessible within less than 10 minutes by car/on foot, between 10 and 20 minutes and between 20 and 30 minutes. The calculation of the isochrone and isodistance areas helps optimize one’s network grid, both in the context of the opening or closure of a sales outlet, to study the impact on the target customer base. There are numerous options for adjusting these areas’ geographical footprint: cover, direct and reverse direction, additive and subtractive construction…
The customer area
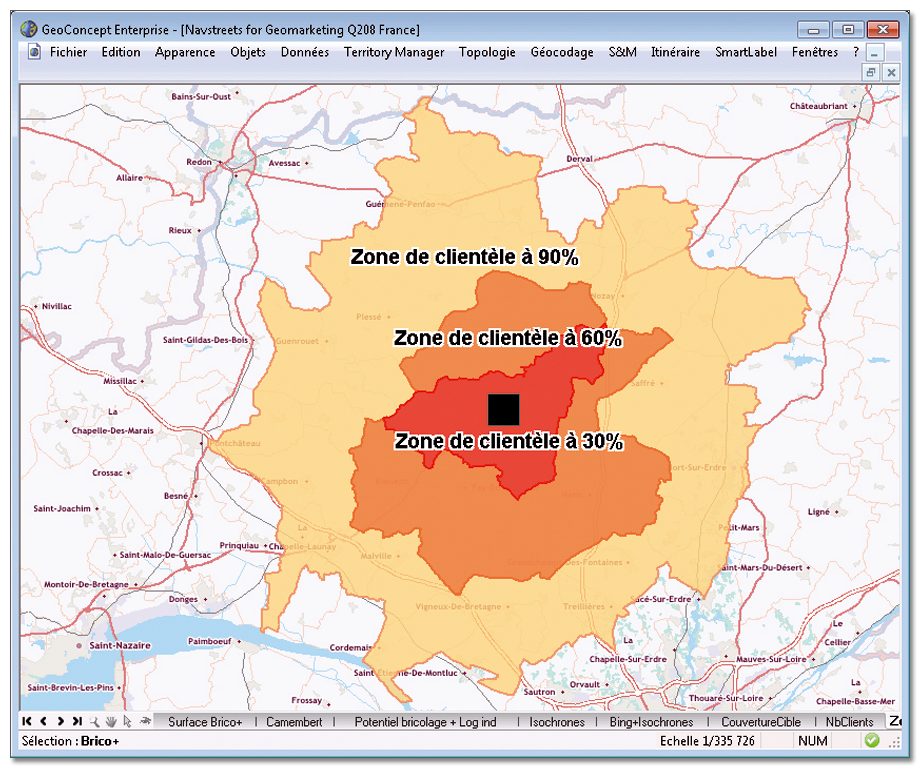
The customer area is calculated from the customer database (capturing of postcodes in store, analysis of loyalty card addresses…) and enables an accurate analysis of where the real customer base comes from. The customer area corresponds to the geographical area encompassing a configurable percentage of customers; one also talks about the area of concentration of the customer base around one or more sales outlets. For example, a 50% customer area represents the area within which half the customer base is located. A very concentrated area around the sales outlet means that the customer base is accustomed to consuming close to its home. Conversely, a very wide area indicates the customers are prepared to cover many miles to visit the sales outlet. It is always interesting studying one’s customer areas because they reflect the customers’ consumption strategy which it is vital to take into account in one’s company’s sales outlet development strategy.
The targeting area
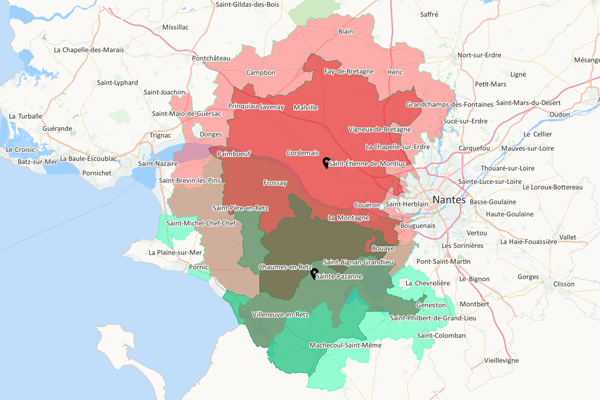
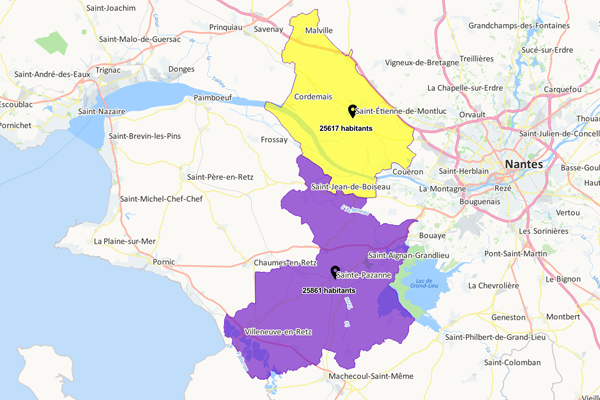
The targeting area is an optimized area for direct marketing activities, in relation to a clearly defined target to be achieved. This area, defined around a sales outlet, enables you to identify customers, prospects, IRIS, postcodes or any other geographical entity that is the subject of a communication campaign and within the confines of a threshold not to be exceeded (corresponding, for example, to the quantity of unaddressed printed matter (UPM) to be distributed). The targeting area therefore enables the efficient preparation of any type of local marketing campaign (UPM, postal mail, e-mail…) and ensures its profitability.
The theoretical attraction area
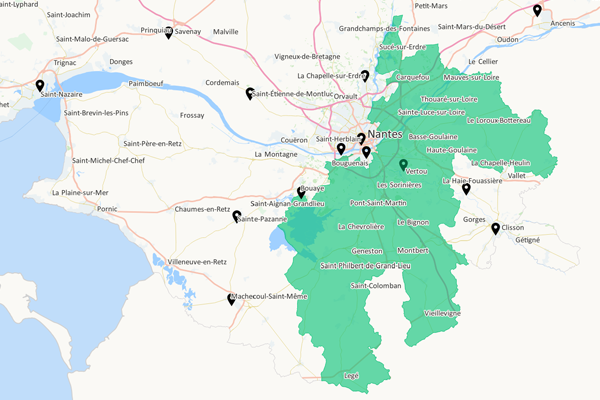
The theoretical attraction area helps evaluate the attractiveness of sales outlets by taking account of the presence of competitors. Based on a gravitational attraction model, the calculation of the theoretical attraction area takes account of the attractiveness of the sales outlet (for example the store’s surface area), its accessibility but also the surrounding competitive environment. The theoretical attraction area determines all the geographical units with a minimum potential determined relative to an identified target statistical metric (for example the number of households owning a primary residence). The wider the area, the better the target is particularly well represented. The brand is therefore in a strong position within the territory. It should be noted that the gravitational attraction model can also be used to find the ideal site for a future opening, or to calculate the impact of a new site on competitors.
Discover the geo-marketing software to analyse your catchment areas
The catchment area can be determined thanks to different techniques :
- with an accessibility analysis (determining isochrones, for example a less than 15-minute drive time catchment area), or with a gravity model, for an even more precise assessment
- with an analysis determining the geographical origins of the existing customers (store survey, delivery note analysis, postcode capture, check addresses analysis...)
Determining the catchment area of your sales outlet is very important : you can then analyze its sales potential, according to your customers and competitors. You can carry out this analysis before setting up your new sales outlet, in order to choose the best location, but also after to optimize your marketing methods (communication, means of signaling, offer adapted to your customers...).
Comparing the potential of an area with its existing customers helps you analyze the possible improvements you would have to carry out in your local communication (poster campaigns, mails with and without addresses, advertisement in the press).
Moreover, creating and displaying isochrone areas enables you to identify the customer coverage of each of your sites and to display areas not covered or cannibalized areas.
An expert in geomarketing for the past 20 years
GEOCONCEPT provides decision-makers and operations staff with a complete range of solutions with a wealth of functionality and web versions that facilitate interaction between company stakeholders:
Geomarketing analysis : optimized decisions
Creation of catchment areas, calculating potential, thematic analysis, site simulation
Geocoding, sectoring, predictive analysis, web portal, reporting...
Powerful tools to control your geography and to optimize your sales and marketing decisions
